Recent research has shown that the contents of cells are organized not only through membrane-bound organelles, but also through membraneless biomolecular condensates assembled by liquid-liquid phase separation.
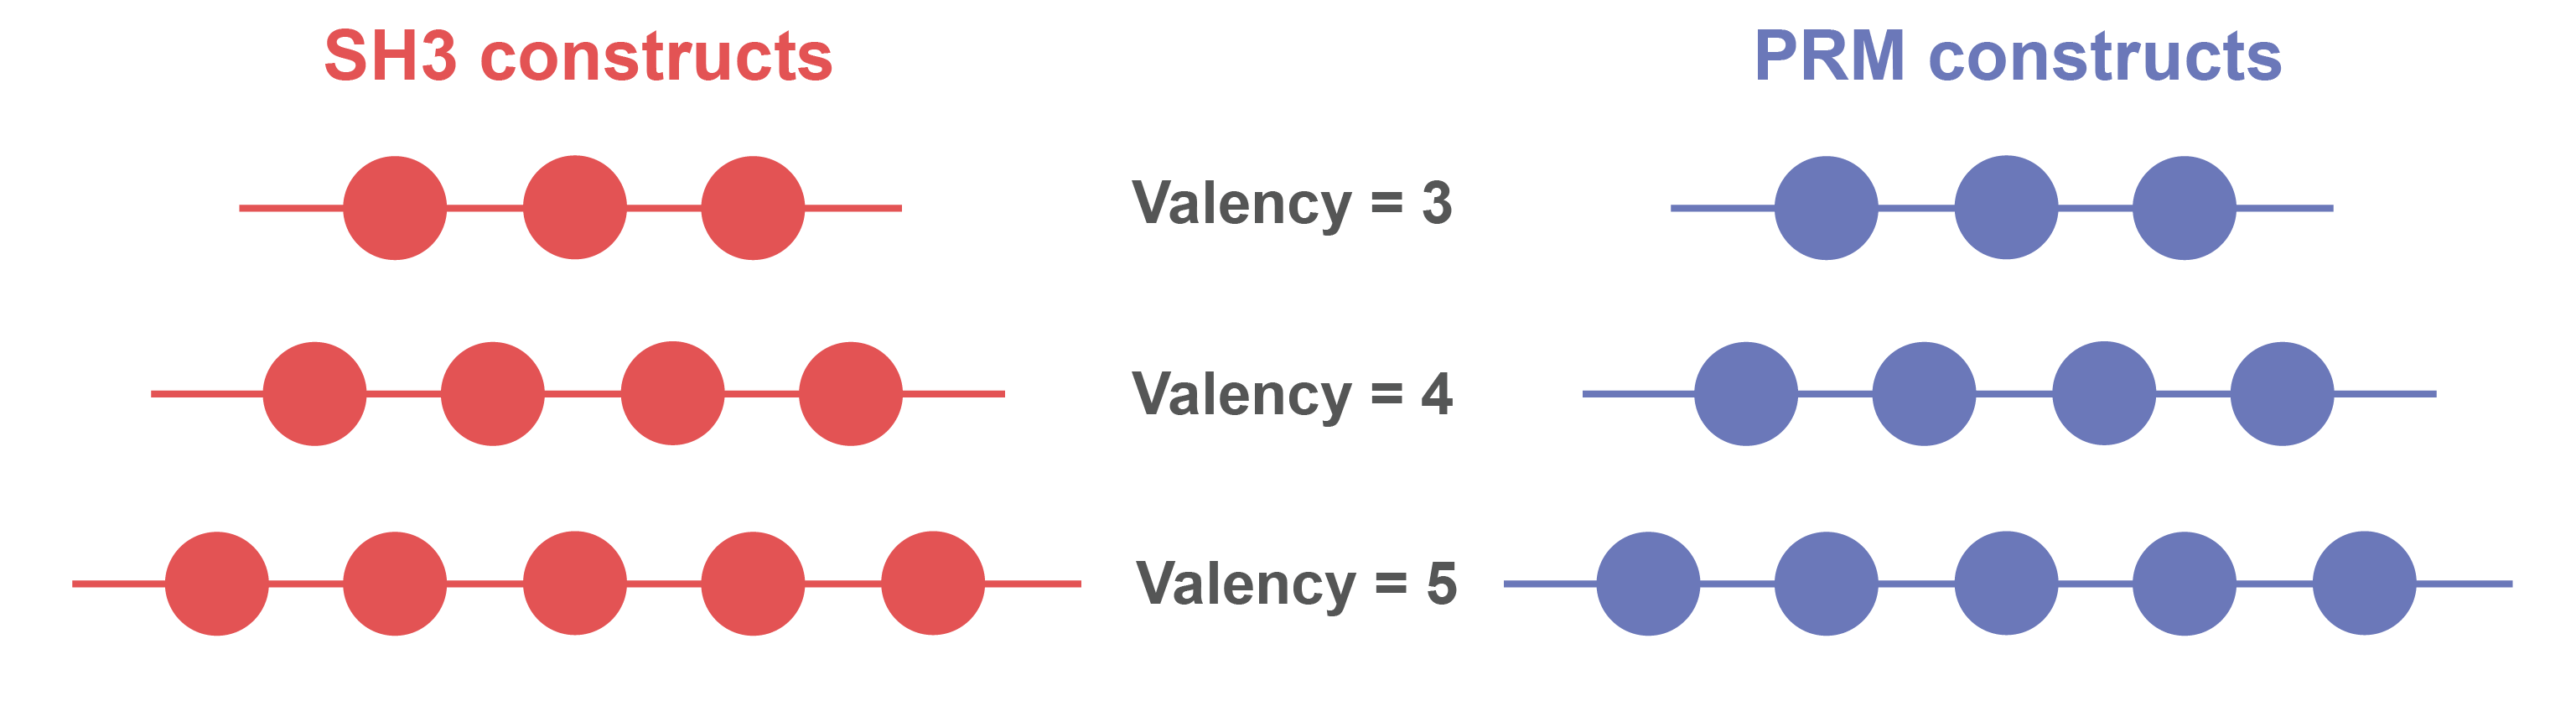
Intracellular phase separation generally involves multiple weak interactions between macromolecules that contain repeats of several binding sites. Such molecules are said to be multivalent, and the number of repeats defines the valency of the molecule.
This interactive computational experiment aims at studying the influence of concentration and valency on the capacity of macromolecules to phase separate.
It was designed and implemented by Margot Riggi, under the supervision of Janet Iwasa and in collaboration with Ofer Rog (University of Utah). This work was funded through NSF grant 2219605.
We recommend visiting this webpage on a computer.
As a case study, we will focus on protein constructs containing a variable number of SH3 or PRM domains, here represented as red and blue spheres respectively. These two domains are able to interact with each other, and are commonly found in repeats within signaling proteins.
For each condition tested, we will visualize in parallel:
> A simulation of the system at the molecular scale, accompanied by a graph showing the evolution of the size of the clusters over time, normalized based on the total number of molecules present in the system.
> A schematic animation of the system at the macroscopic scale that reflects the experimental results from this study (Li & al, Nature, 2012).
Importantly, the animations may not always perfectly align with the results from the corresponding simulation at the molecular level. This could be due to various potential reasons, including unperfect parametrization of the simulations, or the fact that simulations are performed with a limited number of molecules.
Note that the time scale of both visualizations is also different.
The main points to remember from this experiment are summarized in the video at the bottom of the page.
Instructions:
1) Select the two conditions that you wish to compare by clicking on the corresponding dots in the plots below:
> Each plot corresponds to constructs of a different valency.
> Within a plot, each dot corresponds to a different combination of SH3 and PRM domain concentration.
2) Load the visualizations of the experiments by clicking on the corresponding button below the plots. Re-loading is required each time you change a condition.
3) The play button lets you start and pause both videos simultaneously.
Watch the video below for a summary of the main findings of this experiment!
Right click on the video to download.