METHODS
How to measure flux?
Metabolic flux can be inferred through the use of isotopic tracers along with Mass Spectrometry (MS) or Nuclear Magnetic Resonance (NMR). Stable-isotope-assisted methods like 13C-MFA (Metabolic Flux Analysis) is a gold standard for accurate and precise flux information.
The workflow for 13C-MFA first involves designing an optimal tracer experiment or metabolite labeling that is measured by MS or NMR. To quantify fluxes at the systems levels i.e., at very large scales the tracer data is synthesized using computational models. That means labeling measurements are fit to a metabolic network model constructed based on large network databases like KEGG or BioCyc. There are some computational programs that help reach the best global fit for flux estimation and this is followed by statistical analysis to evaluate the fit. This is an iterative process. Based on the result, if the solution is not optimal, the network could be modified or further labeling experiments could be proposed.
Other methods for quantifying metabolic fluxes in biological systems is the Classic MFA without tracer analysis, Flux Balance Analysis (FBA) and a broad range of constraint-based reconstruction and analysis (COBRA) methods. These techniques require no 13C-labeling experiments, so involves fewer experimental data. But, to constrain metabolic fluxes multiple modeling assumptions and simplifications must be applied. There are some established tools that help with FBA interactivity and visualization such as Escher-FBA and Fluxer.
Carbon Tracing
We saw earlier how tracing experiments are the very first and important step towards adequate resolution of fluxes with the 13C-MFA method. Estimated fluxes are highly dependent on the specific choice of isotopic tracers. Optimal tracers are identified via in silico simulation. There can be single, mixed and parallel labeling experiments for flux resolution throughout central carbon metabolism using commercially available glucose tracers. For eg., [1,2-13C]glucose and [1,6-13C]glucose is a good combination for a typical prokaryotic metabolic network. The tracer experiment should be performed in a way that metabolism is maintained at metabolic steady state, so that labeling is fully incorporated.
Flux Balance Analysis

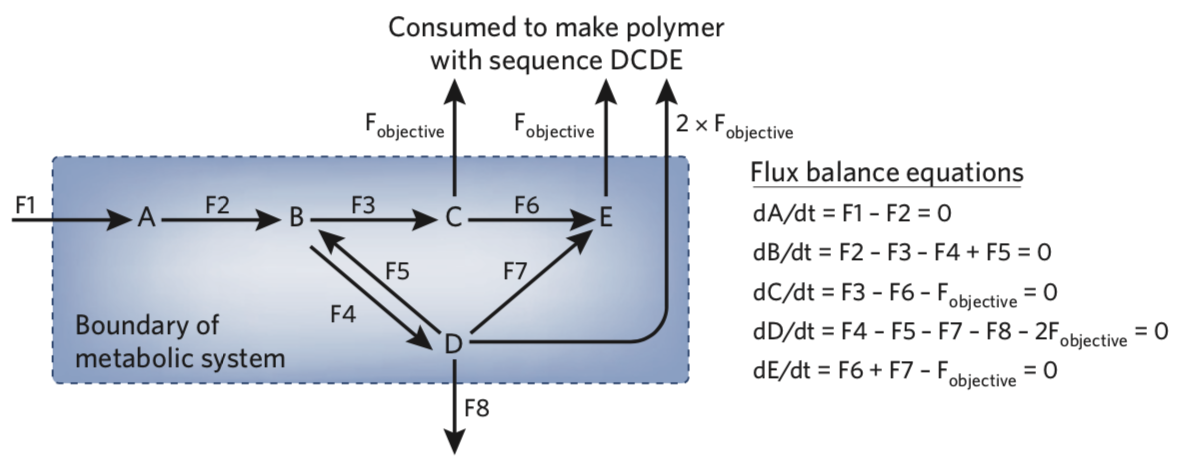
This is a toy network from Joshua Rabinowitz and Livia Vastag (see reference 6 below). But first, what is Flux Balance Analysis (FBA)? FBA is a mathematical or computational modeling method for studying flow of metabolites through metabolic networks at steady state. Steady state is having both metabolic fluxes (reaction rates) and the intracellular concentration of metabolites constant over time. In other words, what goes into the cell must come out (or become biomass), or production and consumption of metabolites must balance each other out. Therefore, balancing of fluxes can help us analyze metabolic networks, and flux balance equations for this toy network has been shown to the right. Each metabolite's rate of concentration change is expressed as a differential equation and have been set to zero. If F1 is 10mmol/h and all fluxes are positive (or zero), what would the maximum rate of synthesis of the tetramer DCDE (F objective) be? See reference 6 to check your answer. If you were able to tackle this small network, you will be ready to look into real metabolic pathway examples.